Analytics for the rest of us.
See what's there. Explore what stands out. Understand what it means.
Your numbers become rankings, comparisons, and trends — visualized and ready the moment you look. No expertise needed.
Right on your device.
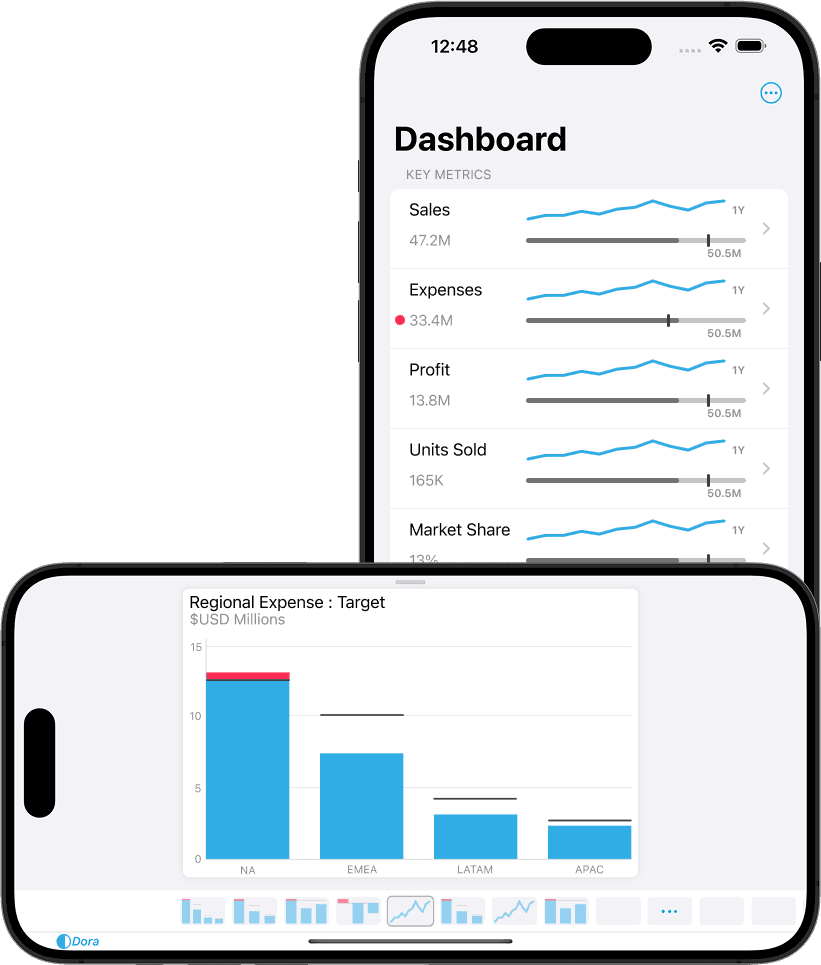
See what matters.
Dora gives you the big picture first — so you never start lost in the details. Who's ahead, how things compare, where things are heading. You see what your numbers show before you ask a single question.
See rankings, comparisons, trends, and outliers.
Rankings.
Who's leading this quarter. Products by revenue, teams by performance, regions by growth — sorted from most to least and clear at a glance. You never pick a chart type, configure a view, or decide what goes where. What you see is already right — clear, accurate, and designed for your numbers.
Comparisons.
This period vs. last. One group vs. another. Actual vs. expected. Side by side. No formulas. No calculations. No setup.
Trends.
What's growing, what's declining, and where something changed direction. A pattern that took weeks to surface in a report is right there in the overview.
What stands out.
When something breaks the pattern — a spike, a drop, a value that doesn't fit — it's highlighted for you. You don't search for the exception. It finds you.
No charts to build. No software to learn. No reports to wait for.
Explore what's interesting.
Something catches your eye — select it. The analysis adapts to what you're looking at. You see the comparisons, breakdowns, and perspectives that apply. Each question leads to the next view, and the next view is already there.
Explore deeper views, filters, time comparisons, and new angles.
Go deeper.
Start with the overview, then select a region, a team, a product. Each selection takes you one level deeper. A number that looked steady at the top shows a turning point when you look one level closer.
Filter and focus.
Remove what you don't need. Narrow to one region, one product line, one time period. The view sharpens — showing only what matters right now.
Compare periods.
This quarter vs. last. This month, same month a year ago. The same view, different time — so the difference stands out.
See it differently.
The same insight, from a different angle. Revenue as a total or as a share of the whole. Change in absolute numbers or relative to a target. The right perspective depends on the question — and you switch with one selection.
No formulas. No code. No dead ends.
Understand what's happening.
A number by itself doesn't tell you if it's good or bad. Context does. When every value appears alongside what's typical, meaning becomes visible. What started as a quick look becomes understanding you can act on.
Discover context, connections, and details on demand.
What's normal. What's not.
Every value appears in context — what's typical, what's unusual, what's shifted. A result that seemed ordinary stands out when you see where it falls among everything else. No calculation needed — the norm is visible, so the exception is obvious.
How things connect.
Which products move with which regions. Where performance clusters and where it breaks apart. Connections that take hours to find in a report are right there. Side by side, you see not just the pattern, but what it means.
The specifics, when you want them.
Hover for the exact number. See the precise comparison. Get the breakdown behind the summary. The details are there when you need them and out of the way when you don't.
No manual calculations. No cross-referencing. No second-guessing.
Every answer. The moment you ask.
When every response is instant, your thinking flows. You move from one question to the next — at your desk, in the field, or offline. Dora runs entirely on your device. Every answer is already there.
Instant analysis, wherever you work.
In the field.
Walk the warehouse floor with rankings by location. Check equipment performance at the job site. Review regional numbers between sales calls. Spot production trends on the factory floor. Your phone is all you need.
Always on.
No connection needed. Once your numbers are on your device, everything works offline. On a flight. At a remote site. In a building with no signal. Your analysis keeps up with you.
Private by design.
Your insights never leave your hands. Analysis runs on your device — nothing sent to a server, nothing stored in the cloud. The privacy isn't a setting. It's the architecture.
No server to wait for. No signal to find. No office to return to.
One dataset. Every perspective.
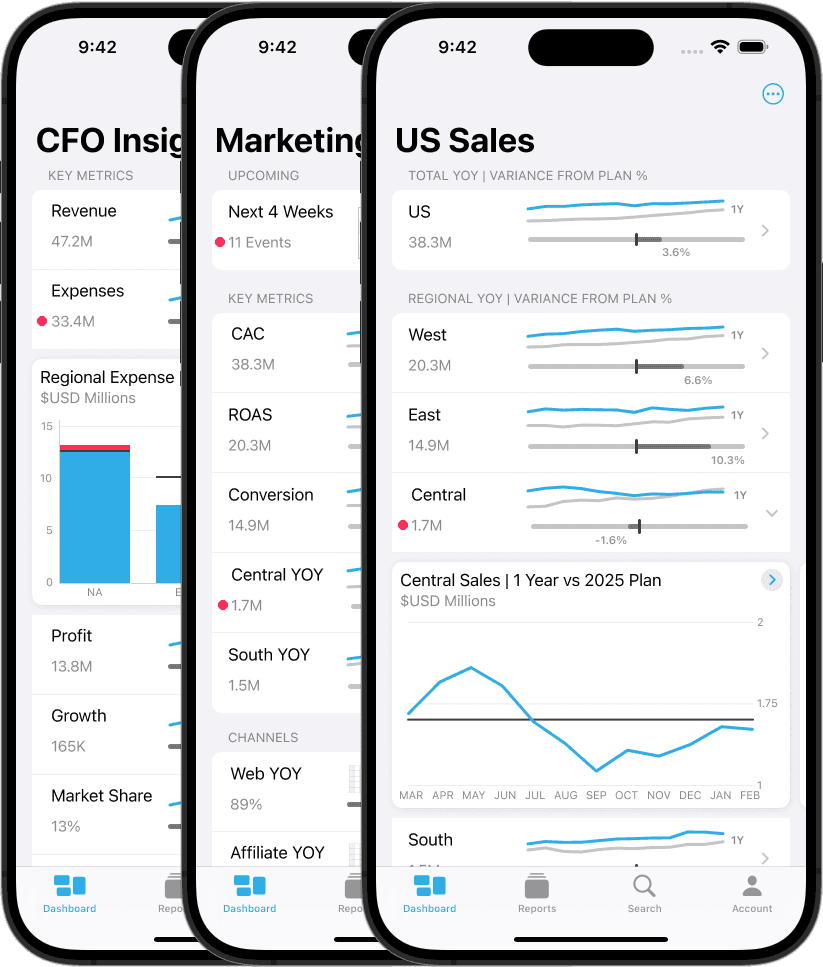
Everything above works for you individually. When your whole team works with the same data, Dora scales with you. One dataset serves everyone — the people doing the work, the managers guiding it, the leaders reviewing it. No duplicate dashboards. No separate reports.
Same data. Different views.
Your sales rep compares territory rankings to spot who's ahead. Your manager reviews team trends to plan the quarter. Your leader sees the broader picture to set direction. Each person sees what matters to their role — from the same underlying dataset.
Every view stays governed.
Analytic Roles define what each person sees and how deep their analysis goes. Each role carries its own analytical context — so insights stay relevant, consistent, and auditable across your organization.
Grow at your own pace.
Start with spreadsheet exports your team already produces. Connect enterprise data sources through Dora's connector APIs when you're ready. Dora fits into your existing systems and scales with you.
How Dora works.
Deterministic AI.
The Analytics Reasoning AI is rule-based, not probabilistic. Same data, same results, every time. Explainable and auditable by design — so you can trust every number you see.
Analytical Framework.
The engine examines data through six types of variation and relationship — categorical rankings, value distributions, spatial patterns, time-series changes, correlations, and inter-category connections. Each analysis works with the values themselves, with metadata defining what each column represents, and with semantic statistics that capture how values relate in context.
Flexible Intents.
Intents are structured queries that carry analytical context — what to analyze, from which perspective, at what level of detail. They power Analytic Roles, adapting the analysis so each person on a team sees insights relevant to their responsibilities — from the same underlying data.
Dora Analytics.
A complete analytics engine that takes raw data and produces scored visual insights. It runs identically on your phone, tablet, or server. No external dependencies. No cloud required. Your analysis travels with you — same engine, every device.
Dora Array.
Dora's implementation of the Apache Arrow format and C Data Interface. The columnar data layer that makes everything above possible. Coming soon as open source. You'll be able to inspect the code we built and evaluate the foundation that powers your insights.
Frequently Asked Questions
For any additional questions, feel free to reach out.
Anyone who works with numbers and wants to understand them — without learning analytics software or waiting for someone else to build a report. Whether you're reviewing sales numbers, tracking performance, or exploring your numbers for the first time, you start exploring immediately.
No. You explore, analyze, visualize, and present from one place. No separate charting tool, no slide deck export, no dashboard builder to learn.
Dora gives you an overview of your numbers — what stands out, what's above or below the norm, how things compare. From there, you explore: select a ranking, compare time periods, filter to a specific group. When you find something worth sharing, present it directly from your device. You start with the big picture and go as deep as you want.
No. Dora guides your exploration — it shows you the comparisons, breakdowns, and trends that are available for whatever you're looking at. You navigate by selecting what's interesting, not by writing queries or configuring charts.
It reads the structure and meaning of your data — what each column represents, how values relate, what kinds of comparisons are valid. It examines six types of variation and relationship — how items rank, how values distribute, how patterns vary across space and time, how measures correlate, and how categories connect. From these, it scores insights by relevance and selects the right visualization for each finding.
Every chart follows proven perceptual design principles — the system cannot produce a misleading or invalid visualization. Deterministic, consistent, and explainable — the same data always produces the same results.
Rankings, comparisons, time-series trends, distributions, correlations, part-to-whole breakdowns, and categorical patterns. You don't choose from a menu — Dora reads what your data contains and shows you the analyses that apply. The interface adapts to your data, so you always see what's possible without needing to know what to ask for.
Through Analytic Roles. Each role defines a scoped view of the same dataset, so every person sees the comparisons and insights relevant to their work.
You start with an overview — the most meaningful comparisons, patterns, and outliers surface first. From there, you explore: zoom into a specific area, filter out what's not relevant, and access details on demand. Each interaction reveals something new, which leads to your next question. The deeper you go, the more specific the insights become.
Dora does not store your data. Analysis runs on your device or on infrastructure you control. Once your data is on the device, you work fully offline.
Dora is coming soon, with the first release focused on phone and tablet. Use the contact link below to follow product updates.
About Dora

Daniel is a software engineer and analytics product developer. He has built analytics software from founding-era startups through enterprise-scale platforms. Every role reinforced the same conviction: the person asking the questions should be the one doing the analysis. Dora makes that possible.